Native desktop performance analysis
This analysis explains why EXEPERT Desktop can feel slow even though GPUI is GPU-accelerated. It separates a user-observed debug run from source-confirmed work, retained release evidence, hypotheses, and changes that have not yet been implemented.
Analysis date: 2026-09-01
The screenshot below came from an ordinary development launch after a clean rebuild. It is useful diagnostic evidence, but it is not a controlled release benchmark. The retained renderer probe is also explicitly non-certifying.
Evidence vocabulary
| Label | Meaning |
|---|---|
| Observed | Directly visible in the supplied running-app telemetry. |
| Reported | Interaction behavior described by the user but not captured by a controlled trace. |
| Confirmed by source | Directly established by the checked-in Rust, scripts, or vendored GPUI code. |
| Historical evidence | Recorded by an earlier retained artifact; useful as a comparison, not proof of the current executable. |
| Hypothesis | A source-backed explanation that still needs an isolated measurement. |
| Proposed—not implemented | A candidate improvement, not a claim about current behavior. |
Executive finding
GPUI accelerates the final rendering backend, but the GPU receives a scene only after Rust has reacted to state, rendered views, laid out elements, run prepaint, shaped text, recorded paths and quads, and decided what to invalidate. The GPU cannot recover time already spent in those CPU-side stages.
The supplied run compounds that normal pipeline with an important variable:
desktop/scripts/run-dev.ps1 executes cargo run --package exepert-desktop --locked. The workspace defines no custom development profile, so this uses
Cargo's standard unoptimized development build. It is appropriate for debugging
correctness, not for judging shipping performance. The supplied screenshot and
retained release probe use different workloads and lack a shared environment
record, so their timing gap cannot be attributed to optimization level alone.
The evidence points to two different workloads:
- Brain: the development worker and paint loop both miss their intended cadence, while the canvas submits thousands of GPUI primitives on each paint.
- Chat: scrolling is virtualized, but wheel handling still allocates row identities, animates discrete wheel input, realizes overdraw, and—in the EXEPERT source—can notify the parent application on every scroll start.
Source map
| Concern | Checked-in source |
|---|---|
| Development launch profile | desktop/scripts/run-dev.ps1, desktop/Cargo.toml |
| Worker cadence and bounded snapshots | desktop/exepert-desktop/src/worker.rs |
| Brain cache, projection, primitive recording, and draw timing | desktop/exepert-desktop/src/render.rs |
| Shared transcript implementation and overdraw | desktop/exepert-desktop/src/ui/transcript.rs |
| EXEPERT transcript ownership and parent notification | desktop/exepert-desktop/src/ui/native_chat_transcript.rs, desktop/exepert-desktop/src/app.rs |
| Codex and DSH transcript ownership | desktop/exepert-desktop/src/ui/codex_transcript.rs, desktop/exepert-desktop/src/ui/dsh_transcript.rs |
| GPUI view, layout, prepaint, paint, and scene pipeline | desktop/vendor/gpui/README.md, desktop/vendor/gpui/src/window.rs |
| Tracked renderer evidence contract | Native desktop GPUI workbench |
Observed debug run
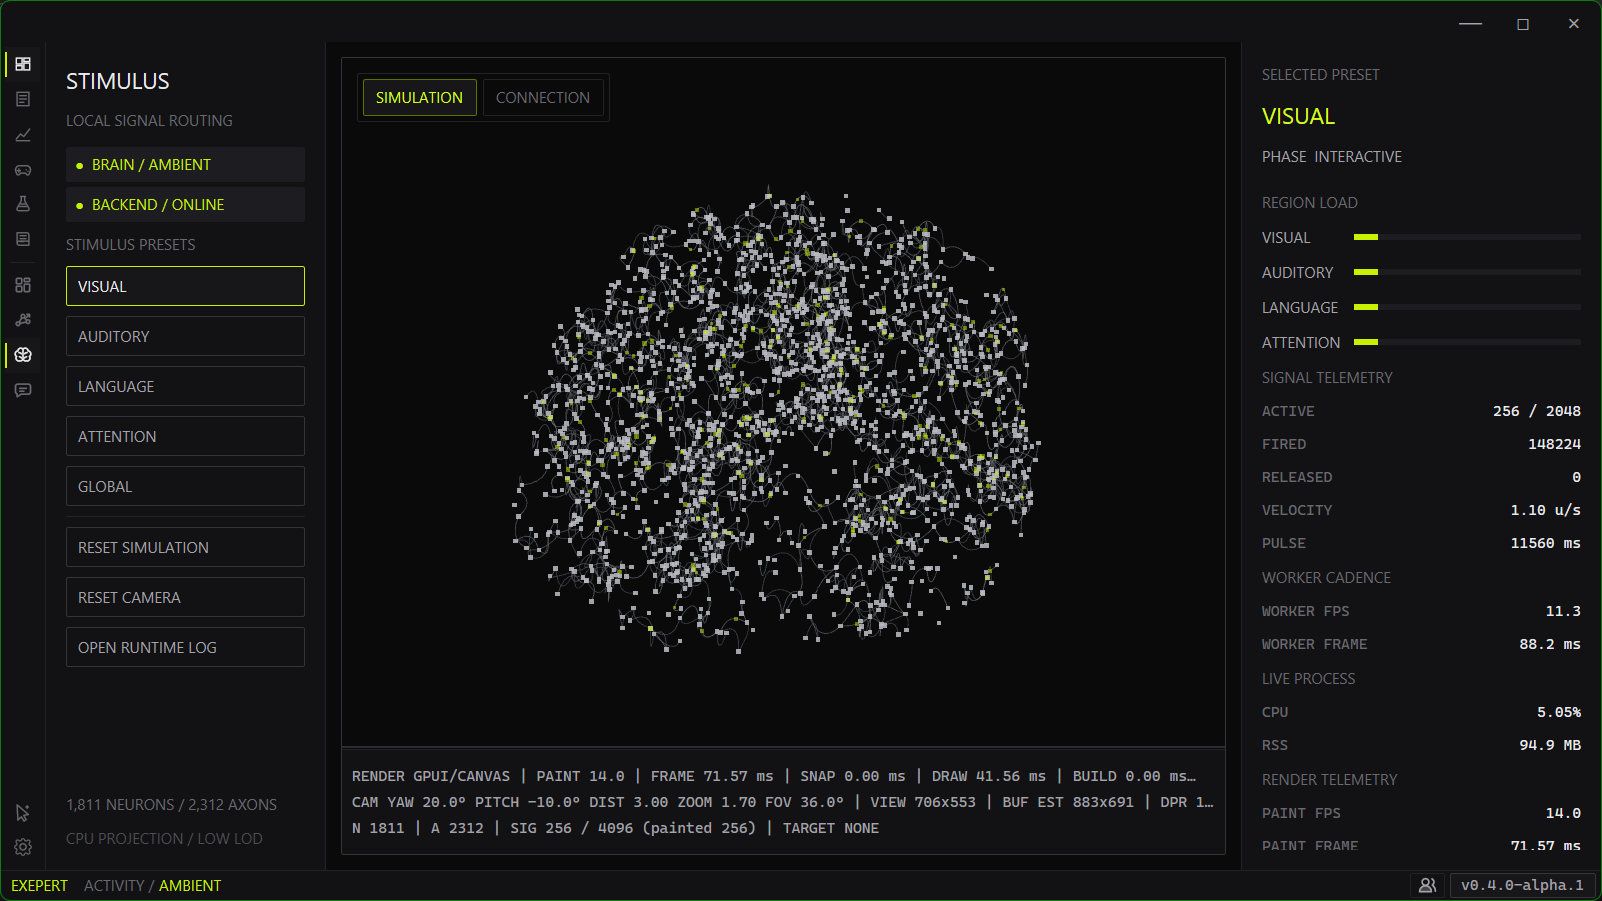
Supplied Brain telemetry from the development executable. Treat these values as an observed symptom, not a release acceptance result.
| Telemetry | Observed value | Interpretation |
|---|---|---|
| Worker FPS | 11.3 | The simulation publisher is far below its configured 50 Hz cadence. |
| Worker frame | 88.2 ms | The development worker misses the 20 ms frame budget. |
| Paint FPS | 14.0 | The canvas presents far below the 50 FPS Brain target. |
| Paint frame | 71.57 ms | The inter-paint interval is well over the interactive budget. |
| Draw | 41.56 ms | Rust-side canvas scene recording is a major part of this observed frame. |
| Snapshot / build | 0.00 / 0.00 ms | No snapshot or build cost was visible at the displayed precision; the clipped telemetry does not independently prove cache state. |
| Process CPU / RSS | 5.05% / 94.9 MB | These are single observed values. They cannot establish thread concentration, memory growth, or retained-data behavior. |
The Brain view contains 1,811 neurons and 2,312 axons, with 256 signals painted
in the supplied ambient frame. The capture is context-only: its commit,
executable path, hardware, power mode, warm-up, and sample duration were not
recorded. The development profile is inferred from the reported
run-dev.ps1 launch and the checked-in script. cargo clean did not make the
runtime slower by itself; it removed generated artifacts and forced the next
launch to rebuild.
Historical release comparison
The retained
desktop/artifacts/renderer-timing-probe-select-element-final.json report is a
10-second, non-certifying local probe. It does not reproduce the current
interactive window: the screenshot paints 256 ambient signals, while the probe
records the 2,048-signal benchmark workload. The comparison is illustrative
only and does not establish what caused the timing difference.
| Historical measurement | Value |
|---|---|
| Active-frame p95 | 24.8969 ms |
| Active-frame samples | 504 |
| Draw samples | 505 |
| Mean draw duration | 8.0129 ms |
| Draw range | 6.3505–12.3740 ms |
| Static render-cache hits / misses | 505 / 0 |
| Published / dropped snapshots | 510 / 17 |
| Dropped snapshot rate | 3.33% |
Historical evidence: the local artifact reports status OK and an active
frame p95 below 40 ms. It did not meet the proposed 20 ms interactive Brain
target, and it does not certify the current app or hardware. The ignored JSON
does not record a source commit, executable hash/profile, or complete hardware
environment, so the exact numbers are not independently auditable. Use the
tracked renderer evidence summary
for hash-qualified gate history. An UNVERIFIED or non-certifying report must
never be described as PASS.
Why GPU acceleration is not automatic speed
The checked-in GPUI README describes GPUI as a hybrid immediate/retained,
GPU-accelerated framework. It also documents that GPUI calls a view's Render
implementation to build an element tree that must be laid out and converted to
pixels. The vendored window pipeline then requests layout, runs prepaint,
records the next scene, paints the element tree, and finally submits that scene
to the platform renderer.
GPU acceleration helps the last stages. These earlier costs still matter:
- rebuilding a large view tree after a broad
cx.notify(); - allocating or cloning hot-path data;
- laying out and shaping visible text;
- realizing more virtual rows than the viewport needs;
- recording thousands of individual canvas primitives;
- scheduling animation frames after useful work has stopped; and
- blocking the GPUI thread with simulation, I/O, or synchronization.
Brain rendering findings
Confirmed by source
The simulation worker declares SIMULATION_HZ = 50 and a 20 ms step interval.
Frames travel through a one-frame bounded snapshot channel, so a slow consumer
does not create an unbounded queue.
The Brain canvas correctly separates static and dynamic work:
- viewport/camera-dependent axon paths and neuron bounds are held in a render cache;
- a cached snapshot reports zero static build time when its key is unchanged;
- the retained historical probe recorded 505 cache hits and zero misses; and
- telemetry updates use a separate store so telemetry refresh does not have to invalidate the canvas.
Cached geometry does not eliminate per-frame scene submission. During each
draw_canvas call, Rust:
- records the canvas background;
- submits four cached axon path buckets;
- loops over 1,811 cached neuron bounds and calls
paint_quadfor each one; - projects every active signal and records another quad; and
- records the baseline and optional inspector highlight.
The displayed DRAW value surrounds this Rust draw_canvas work. It is not a
pure GPU execution timer, so a high value can reflect scene construction and
primitive submission before the GPU presents the frame.
Interpretation
- Observed: development draw time was 41.56 ms.
- Historical evidence: release draw time averaged 8.0129 ms with a 24.8969 ms frame p95.
- Confirmed by source: static projection is already cached, while primitive recording and dynamic signal projection still run per paint.
- Hypothesis: development-profile overhead may explain part of the observed debug cost. The unmatched signal counts and missing shared environment record prevent causal attribution; controlled release profiling must identify the dominant shipping stage.
Proposed order—not implemented
- Reproduce the same Brain workload in the explicit release executable.
- Record worker step, inter-paint, snapshot, static-build, draw, cache, and dropped-snapshot measurements separately.
- Profile the GPUI thread before changing the worker cadence or visual count.
- Retain or batch unchanged scene primitives where GPUI's paint-reuse contract permits it, then measure primitive count and draw duration again.
- Optimize dynamic signal projection only if the profile attributes material time to it.
Do not raise the worker frequency to mask a slow renderer. That creates more work and can increase dropped snapshots without improving presented cadence.
Chat scrolling findings
Confirmed by source
All three native Chat sources use the same variable-height transcript
implementation and types, while each source owns a separate
TranscriptScrollState. Virtualization prevents the complete conversation from
being mounted, but each list realizes the viewport plus up to 512 px of overdraw
above and below it.
The shared wheel behavior has two paths:
- precision touchpad input and reduced-motion mode scroll directly; and
- discrete line-based wheel input is interpolated for 140 ms and requests animation frames while that glide is active.
The hot path still performs avoidable work:
- Native Chat, Codex, and DSH rebuild a
Vec<TranscriptRowIdentity>and clone every retained transcript row key during wheel handling and animation advancement, including rows outside the realized viewport. - Each realized row is cloned before its native element is rendered.
- The EXEPERT Native Chat wheel handler calls
native_transcript_scroll_started, which cancels tail follow, closes an open message menu, and calls the parent application'scx.notify(). - Codex and DSH wheel handlers notify only their transcript entity, so the extra parent render is specific to the EXEPERT source.
- Visible rows reconstruct their controls, tooltips, focus/accessibility wrappers, and display strings. Stable ZED assistant text views already avoid reparsing unchanged Markdown, showing the intended revision-based direction.
Interpretation
- Reported: scrolling long message history feels visibly sluggish.
- Confirmed by source: virtualization is present; the problem is not that every historical message is mounted at once.
- Hypothesis: broad parent invalidation, repeated identity allocation, row reconstruction, 512 px overdraw, and the 140 ms discrete-wheel animation combine into frame-time spikes. A scroll trace must quantify each share.
Proposed order—not implemented
- Avoid notifying the parent when scroll-start state did not actually change; keep scroll invalidation owned by the transcript entity.
- Cache transcript identities and row presentation data by stable key and content revision instead of rebuilding strings and vectors per frame.
- Measure realized row count and render time before changing the 512 px overdraw or 140 ms glide.
- Tune wheel animation only with separate mouse-wheel, precision-touchpad, and reduced-motion acceptance checks.
- Reuse unchanged action, tooltip, Markdown, and accessibility presentation without removing labels, roles, focus rings, keyboard access, or UIA state.
Proposed interactive budgets
These user-approved targets define acceptance for future optimization work. They are not current runtime gates and do not rewrite the existing renderer-gate contract.
| Workload | Target | Measurement |
|---|---|---|
| Continuous Chat scrolling | 60 FPS / 16.67 ms | p95 inter-paint time during a fixed wheel or touchpad trace |
| Brain publication-driven rendering | 50 FPS / 20 ms | worker and natural-paint cadence during a fixed active workload |
| Existing renderer certification gate | ≤40 ms p95 | unchanged locked benchmark and environment contract |
The budgets should be evaluated independently. A 50 Hz simulation can publish at its intended cadence while the Chat view paints at 60 FPS, and a passing 40 ms certification threshold does not prove either interactive target.
Reproduction record
Use the Rust and GPUI optimization playbook for the complete workflow. Every performance comparison should record at least:
| Field | Record |
|---|---|
| Source and executable | Commit, debug/release, and literal executable path |
| Workload | Brain preset/signal count or Chat source/task/row count |
| View | Client width, height, DPI, presentation mode, and panel layout |
| Input | Mouse wheel, precision touchpad, keyboard, or scripted benchmark |
| Diagnostics | Inspector, Runtime Log, telemetry, and other active surfaces |
| Timing | Warm-up, sample duration, frame count, p50/p95/max, and dropped work |
| Outcome | Before/after delta, regression check, and remaining hypothesis |
Run the same workload at least three times after warm-up and compare like with like. A faster debug build, a different transcript, or a smaller window is not an optimization result.